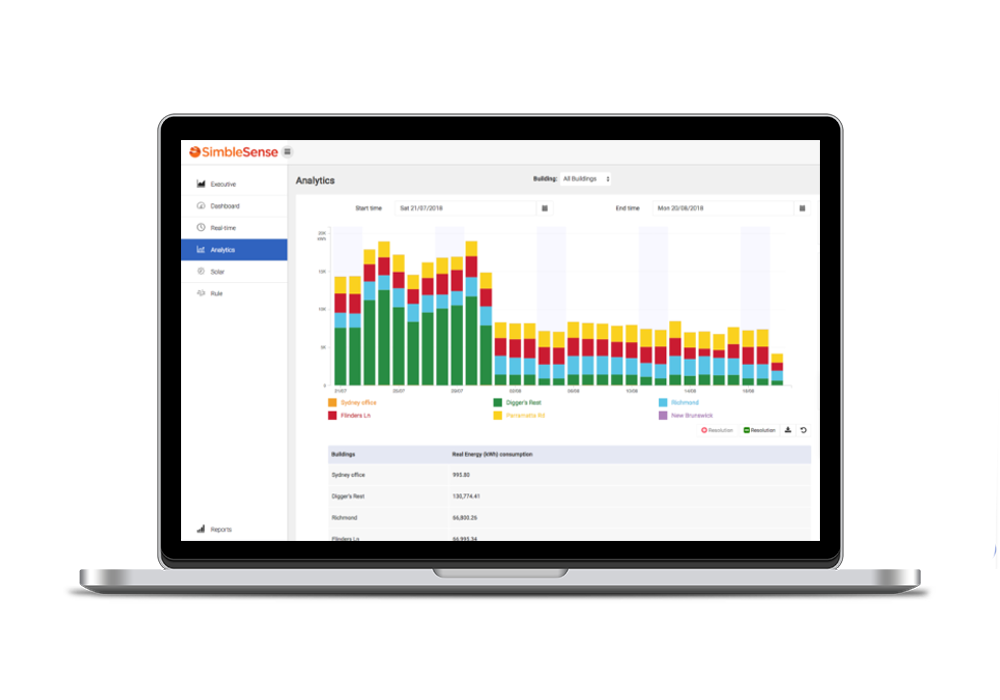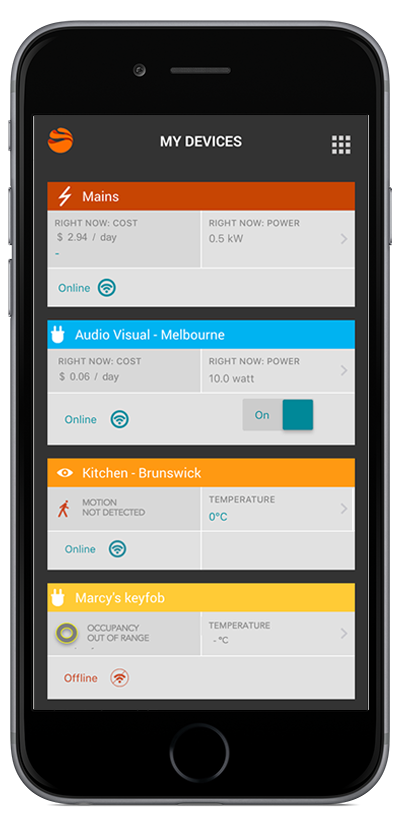
Energy Visualisation & Analytics Platform
Making Energy Visible for Business

Real-time data feeds
An essential operational tool to manage demand costs
Circuit and plug level monitoring and analysis
Intuitive drill-down navigation to understand power quality, usage and cost
Easily spot outliers through heat map visualisations
Identify issues to maximise energy efficiency program ROIs
Verify savings from energy efficiency projects
Hold suppliers accountable for savings from energy efficiency upgrades
Multi-device and multi-site
Benchmark the most energy efficient sites or operational metrics
APIs for integration into existing applications
Integrate energy data into your BMS or facilities database management system
Incorporate environmental sensor information
Use temperature data from IoT sensors for environmental data analytics
Foyer displays for energy consumption
Promote your corporate sustainability with a live feed to your achievements


